
Client
Halliburton
Role
Product Designer
Year
2023
The project aimed to standardize the documentation process for oil extraction in Colombia. This process previously relied on paper and some digital documents in Microsoft Office. The goal was to reduce manual errors, eliminate corruption opportunities, and increase efficiency by fully digitalizing the documentation process.
Role and Responsibilities
As the main product designer, I led the project by gathering business requirements alongside Business Analysts. I conducted a discovery process with key stakeholders to identify pain points and understand the core business processes. This involved mapping out these processes and creating a comprehensive chart to visualize the business workflow.
Problem Statement:
The primary challenge was the lack of transparency and consistency in the fracking process at extraction sites with sparse connectivity. Data uploads were infrequent, occurring every one or two weeks depending on the site. Addressing this would improve team efficiency, streamline documentation, systematize processes for future automation, and reduce corruption.
Research and Discovery

The discovery stage involved surveys and interviews with key stakeholders to pinpoint main pain points. Collaborating with Business Analysts, we simplified the process for users. Wireframes were created to ensure stakeholder understanding and to explore new feature possibilities. These wireframes were tested with users before moving on to prototyping.
Design Process
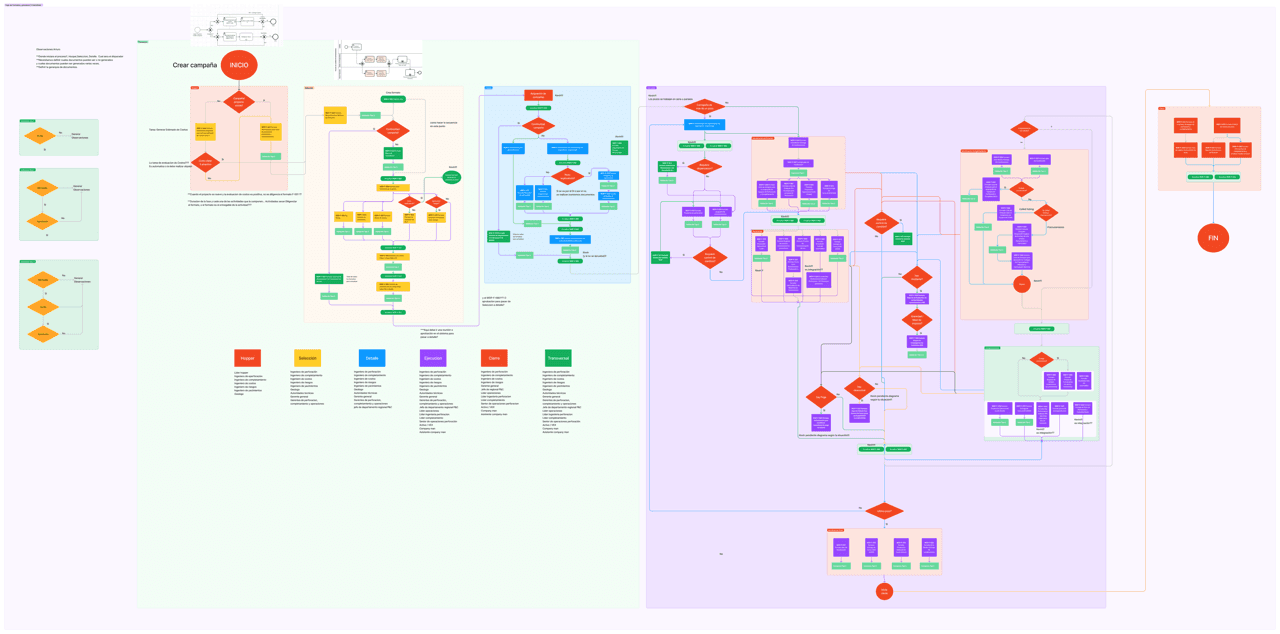
Form dependencies flow chart
The design process involved several stages: data collection and analysis through surveys and interviews to gather user insights; mapping and wireframing to visualize the process and gather feedback; developing prototypes based on wireframe feedback and testing them with users.
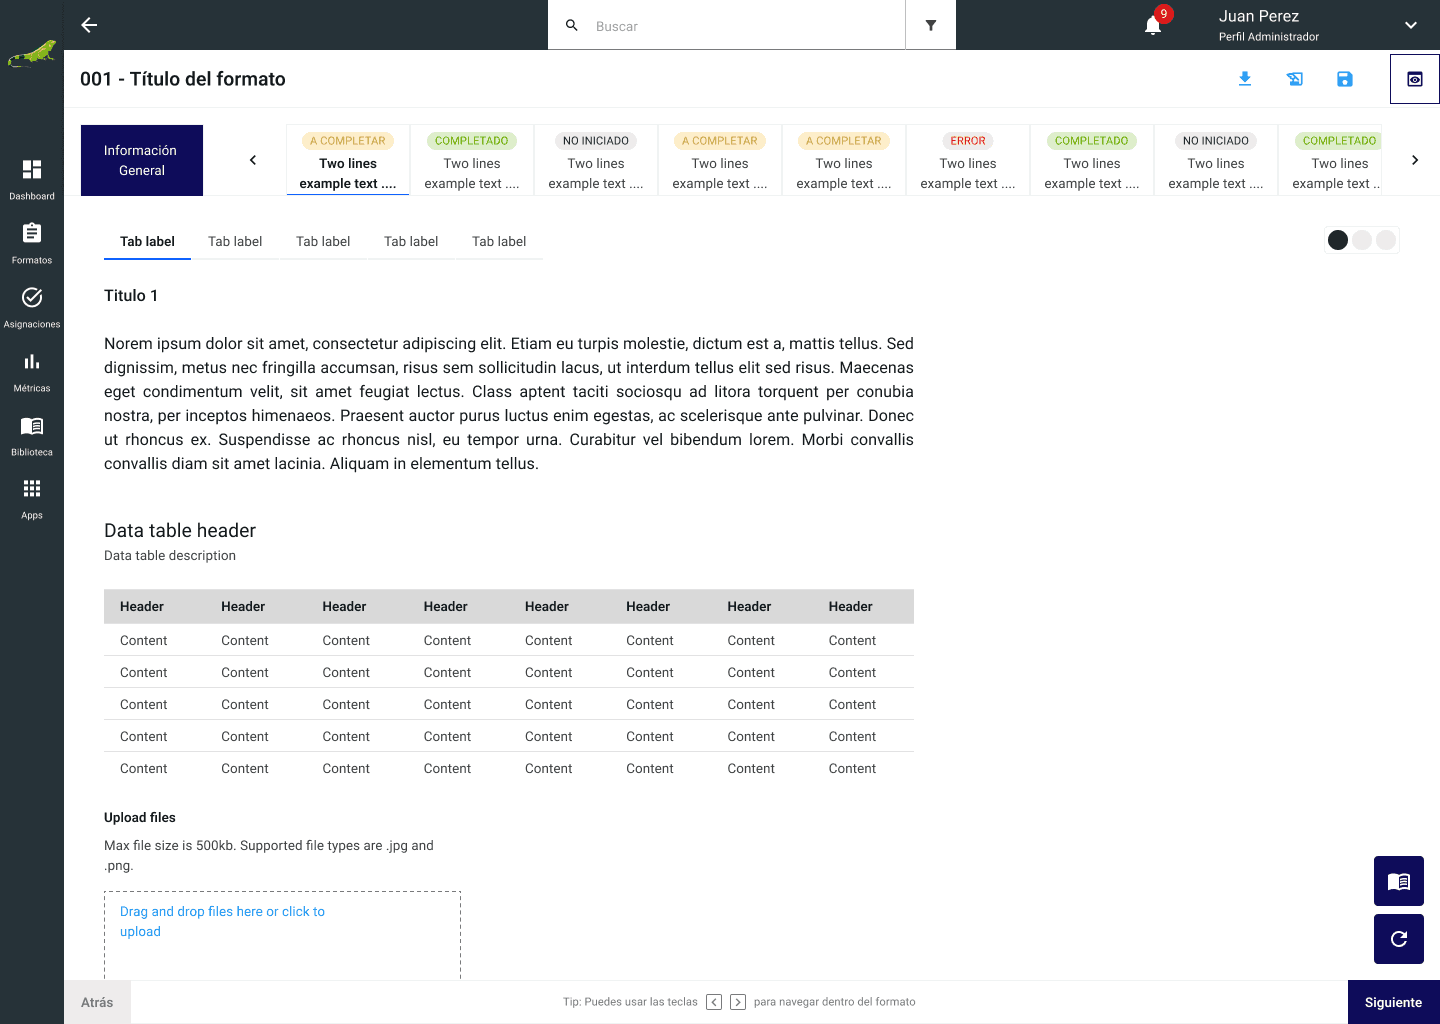
Form template wireframe
Challenges and Solutions
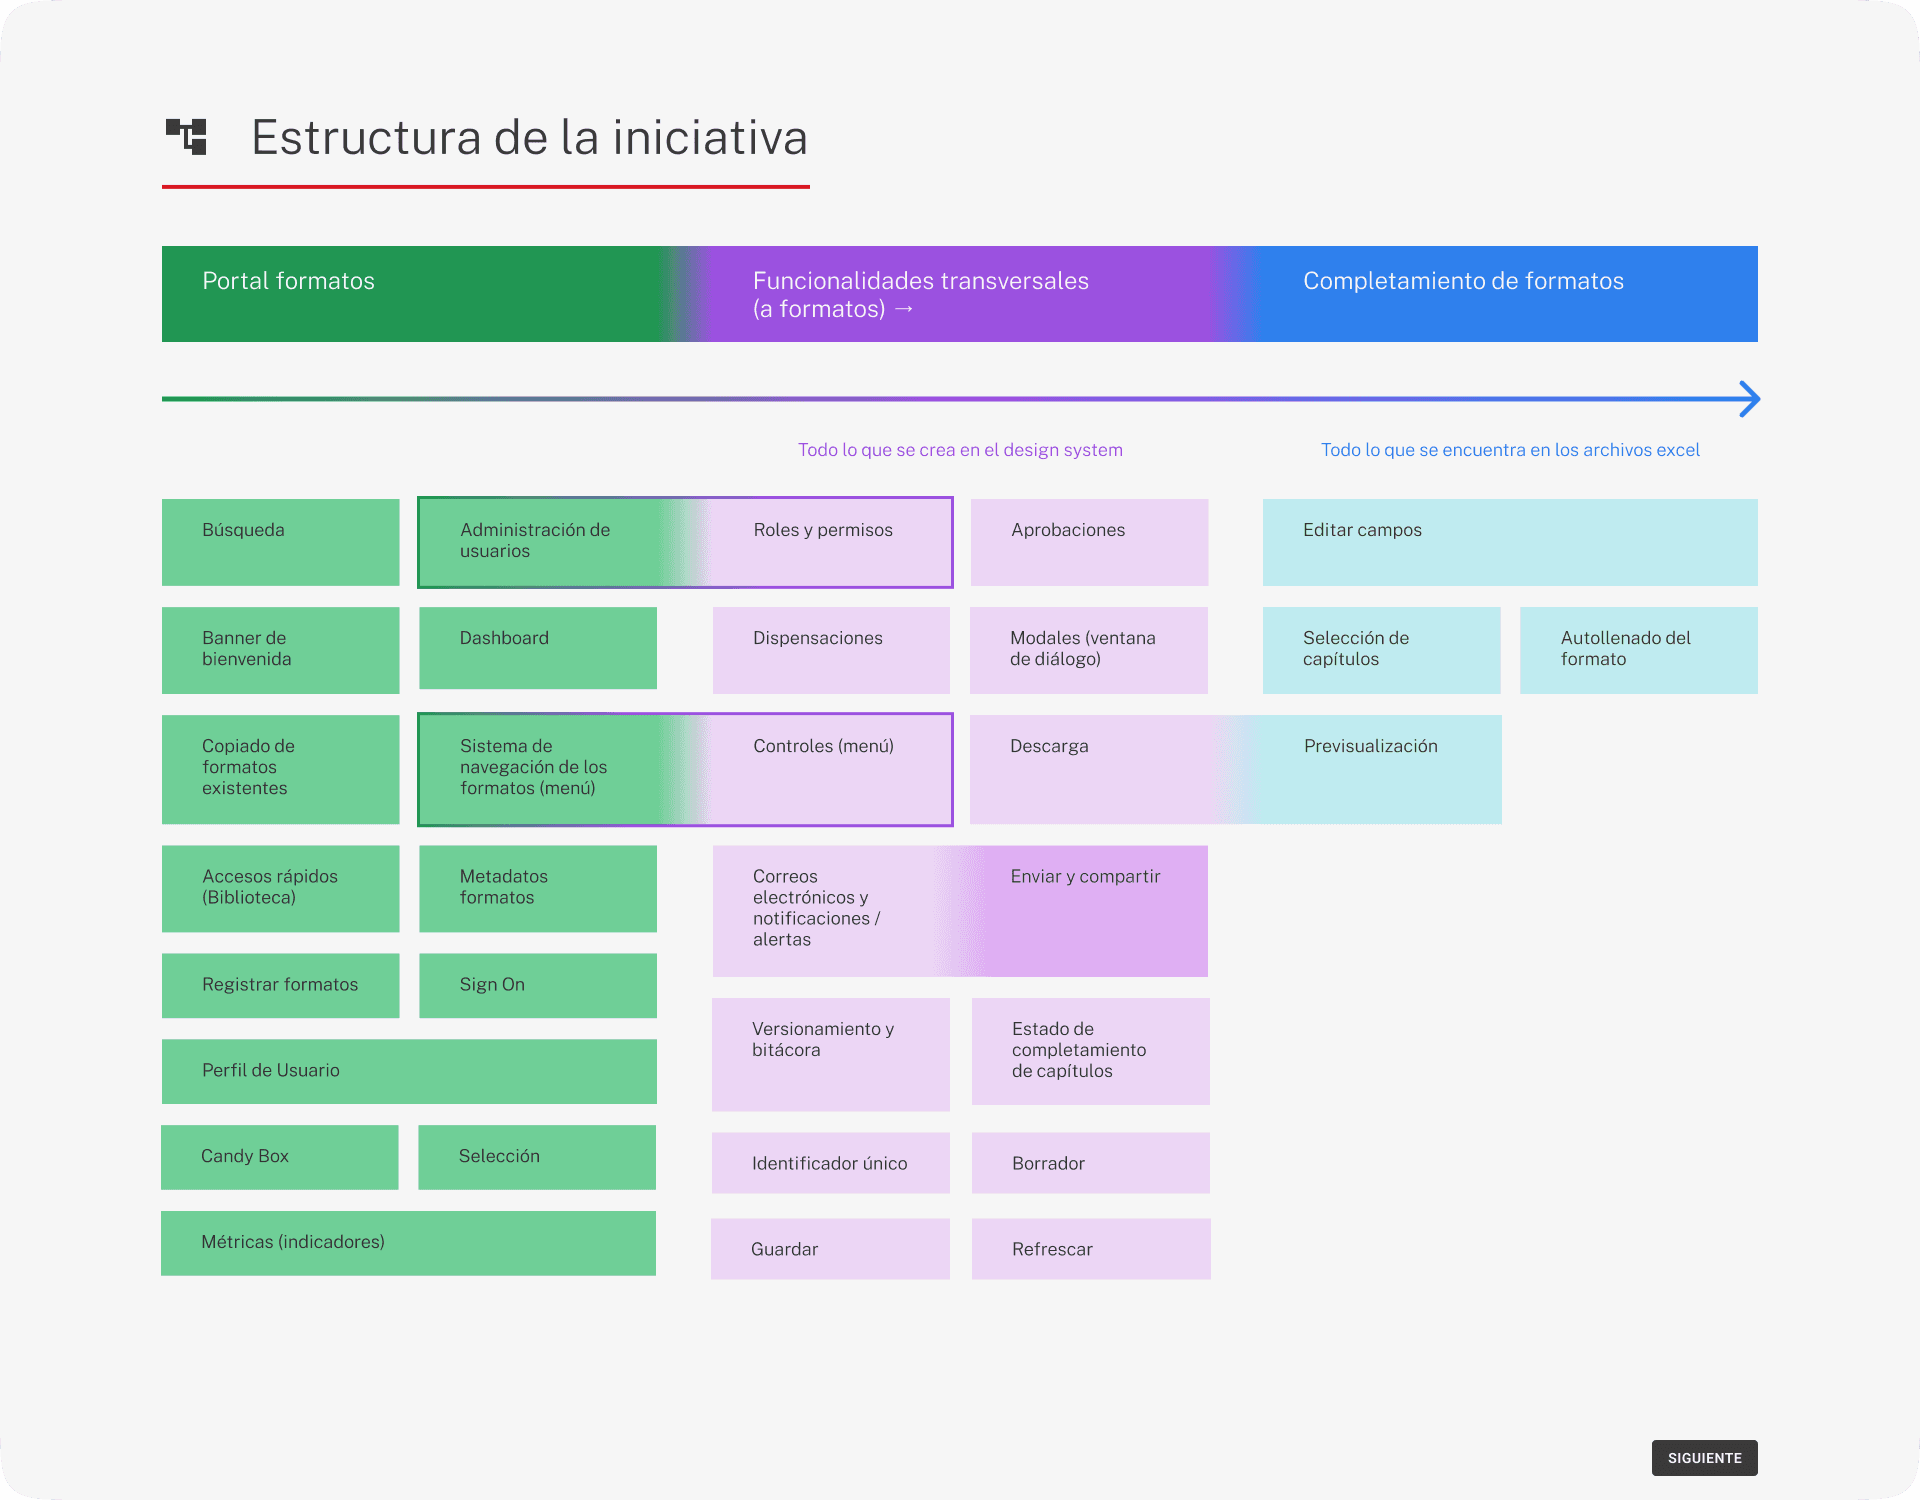
The main challenges were overcoming resistance to digitalization by demonstrating the benefits and ease of use of the new system, designing a user-friendly application for both onboarding and power users, and learning about fracking engineering processes to accurately pull data from various machines and databases.
Design System and Tools
We used a custom design system following EcoPetrol's branding and Halliburton’s existing system. Tools used included Maze, Figma, Zeplin, Angular Framework, Storybook for documentation, and Trello for team organization.
Collaboration and Feedback
I collaborated closely with PMs, developers, other designers, and Business Analysts. Weekly meetings with the development team and working in small cells (designer, three developers, one PM, and one BA) ensured consistency and progress. Horizontal collaboration across cells maintained design system uniformity.
Final Design and Implementation
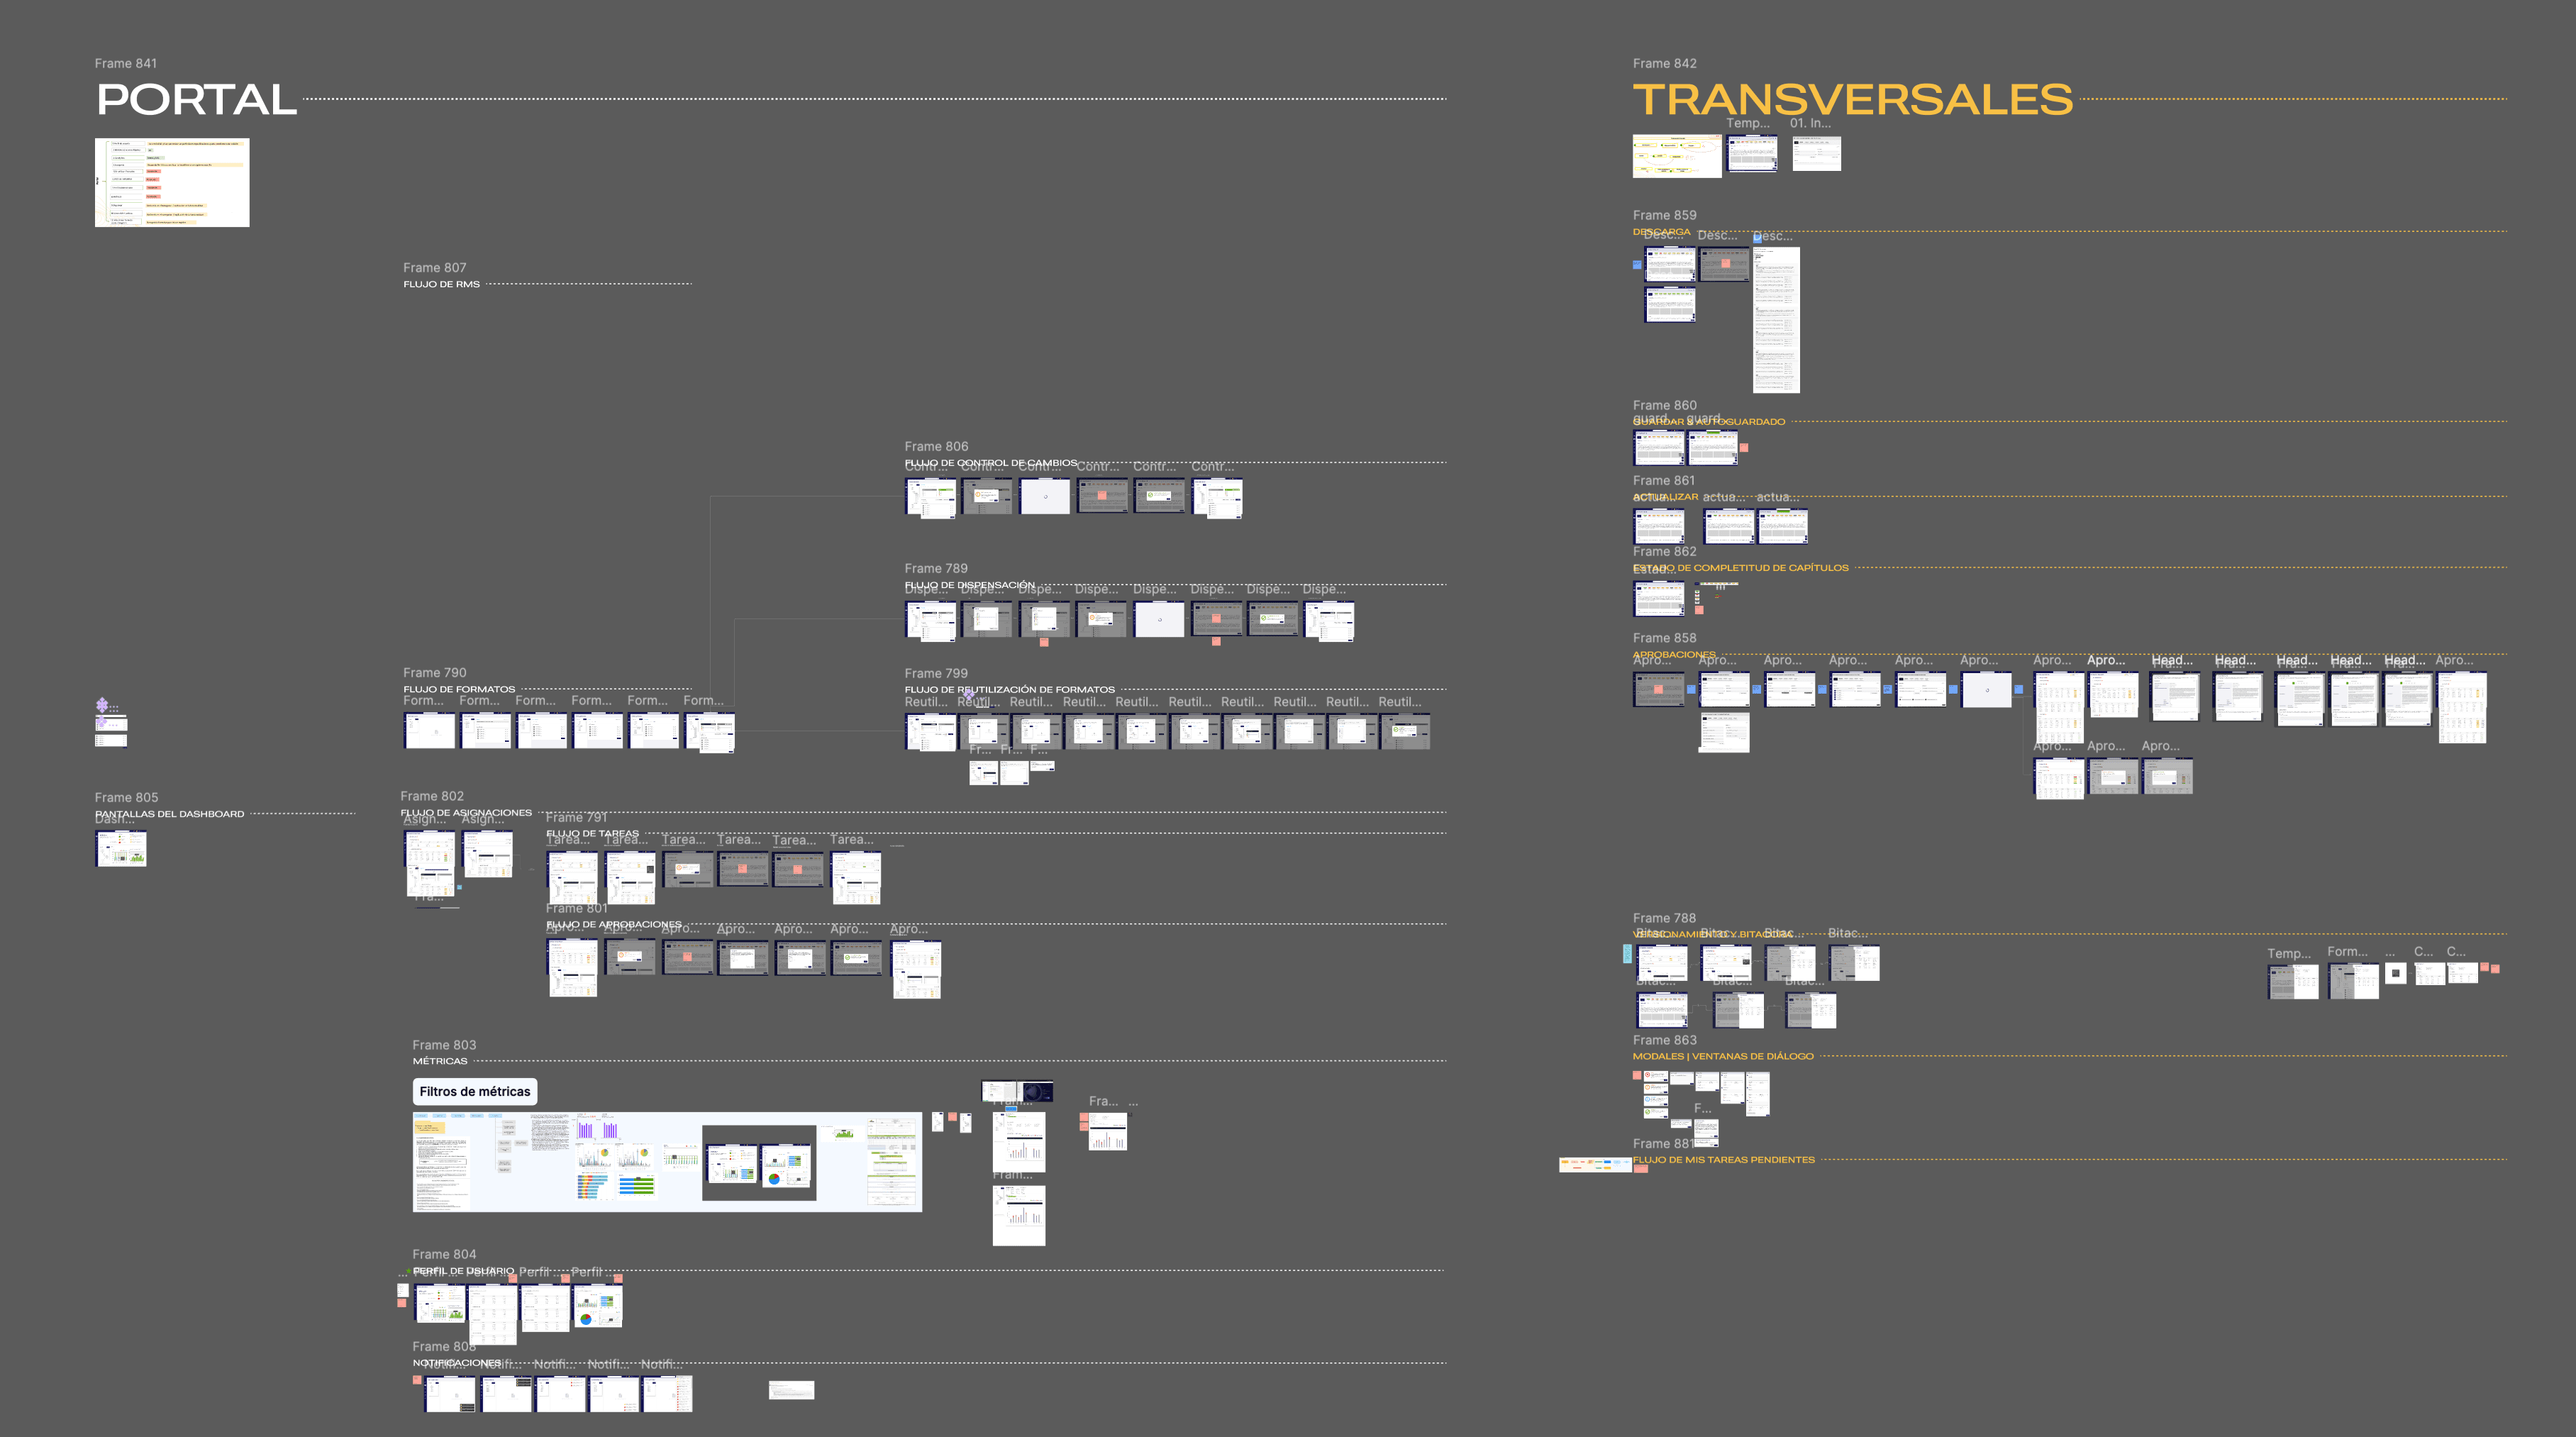
General overview of the workspace of the dashboard interactions.
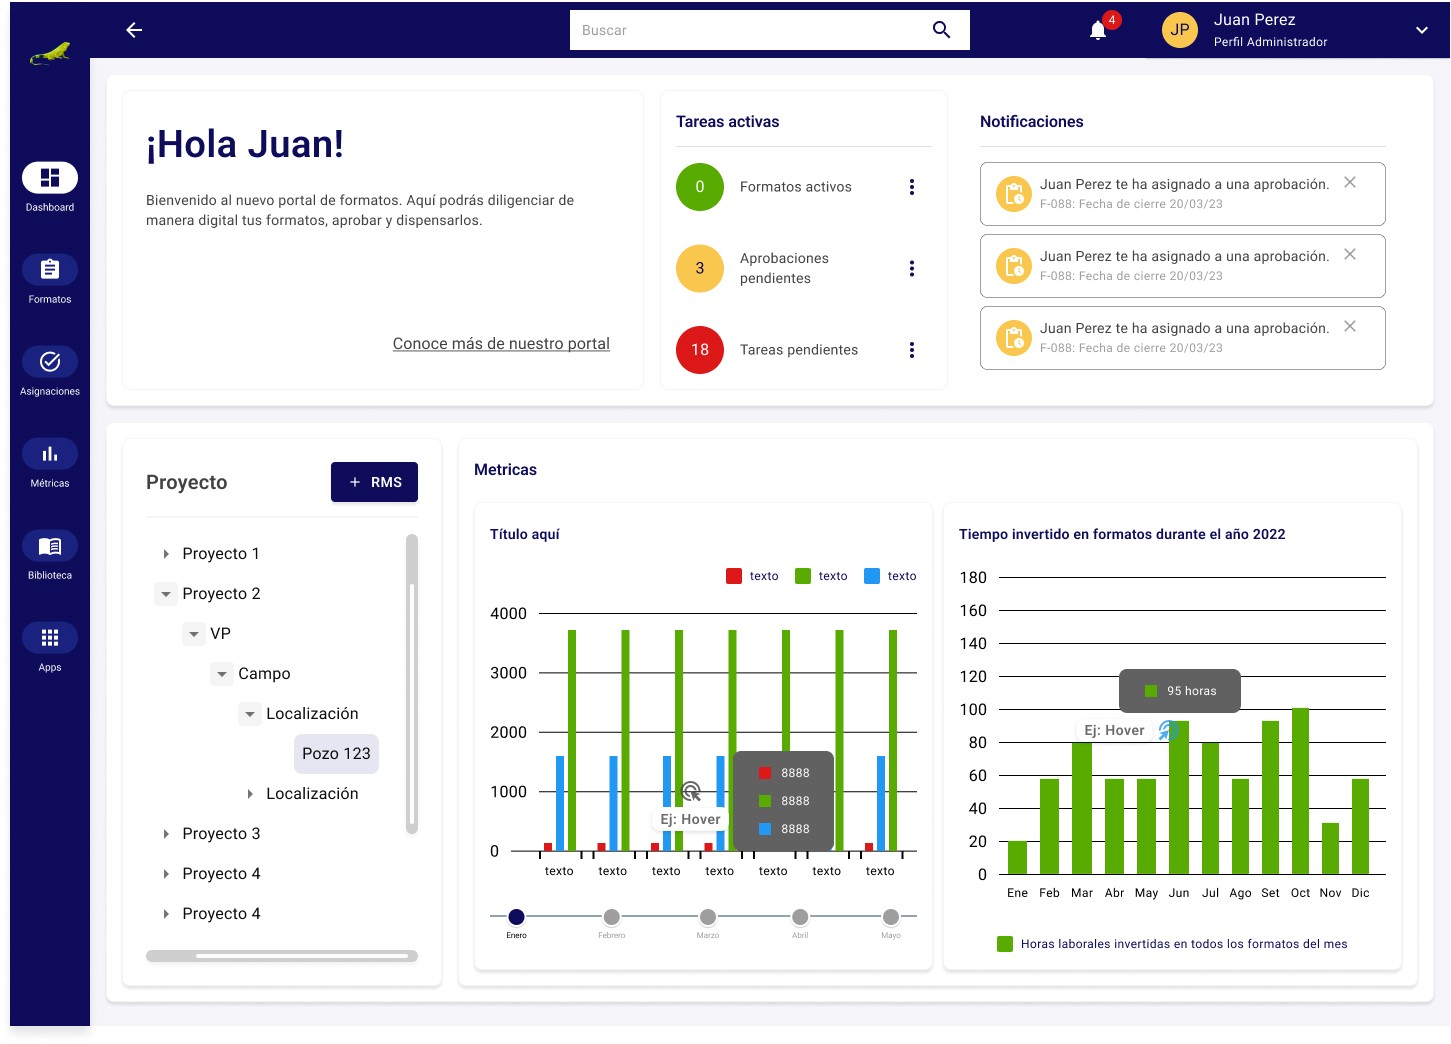
Example of an Analyst level dashboard.
The final design was implemented using the Angular Framework with the custom design system. We created around 80 pixel-perfect screens, documented for BAs, developers, and users. The design included an adaptive dashboard tailored to different user levels.
Results and Impact
Digitalized over 85 manual forms, many of which were automated. Created an adaptive dashboard for various user levels. Received highly positive user feedback with a satisfaction score of 8.8/10.
Lessons Learned
Identifying main stakeholders and funneling relevant information is crucial for project efficiency. Collaboration with developers, PMs, and BAs is essential for project success. Understanding and adhering to business requirements is key to the project’s overall health.
This project demonstrated my ability to lead complex digital transformation initiatives, collaborate effectively across teams, and deliver impactful user-centered designs.